Deriving temporal parameters
Where spatial derivation works within one frame, this combines data across frames — averaging a whole time-resolved sequence into one representative result, or computing turbulence statistics.
Open via Plot → Temporal: Derive parameters (Ctrl+R).
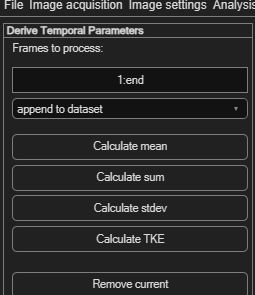
Selecting which frames to include
Frames to process accepts the same range syntax used elsewhere
in PIVlab — e.g. 1,3,4,8:10. For a phase average (averaging
corresponding phases across repeated cycles rather than everything at once), enter multiple
rows: [1:10:end;2:10:end;3:10:end] produces one averaged result per row.
append to dataset (default) adds the result as a new frame alongside your existing data; replace all existing discards previous results first.
Available operations
| Button | Computes |
|---|---|
| Calculate mean | Mean velocity across the selected frames. |
| Calculate sum | Sum of displacements across the selected frames. |
| Calculate stdev | Standard deviation across the selected frames. |
| Calculate TKE | Turbulent kinetic energy across the selected frames. |
Each button appends one new result frame. Click Remove current to delete the currently displayed (appended) frame if you don't want to keep it.
Phase average of periodic flow
For a periodic (harmonic) flow — a flapping wing, a pulsating jet, a rotating machine — the Periodic (harmonic) flow section builds a phase average automatically, so you don't have to write out the multi-row frame ranges by hand.
- Set Frames to process to the frames covering the cycles you
want to average (e.g.
1:end). - Enter the number of frames that make up one period in Periodic (harmonic) flow.
- Click Calculate phase mean.
PIVlab groups every n-th frame together (frame 1, 1+n, 1+2n, …
for the first phase, and so on) and appends one averaged frame per phase —
a single representative period of the flow. It is the equivalent of entering
[1:n:end; 2:n:end; … ; n:n:end] in Frames to process and
calculating the mean, done in one click.