Parameters from poly-line
Draw a line or a circle across your data and extract a profile of any derived parameter along it — a velocity profile across a jet, or a tangential-velocity profile around a vortex core, for example.
Open via Extractions → Parameters from poly-line (Ctrl+P).
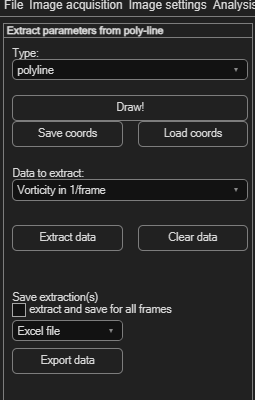
Drawing a line or circle
Choose a Type first:
| Type | How to draw it |
|---|---|
| polyline | Left-click to add each point; right-click to finish. |
| circle | Click twice with the left mouse button: first click sets the centre, second click sets the radius. |
| circle series (tangent vel. only) | Several concentric circles at once — restricted to extracting tangential velocity, useful for a velocity-vs-radius profile around a vortex core. |
Click Draw! to start, then draw in the image. Use Save coords / Load coords to reuse the same line or circle across sessions.
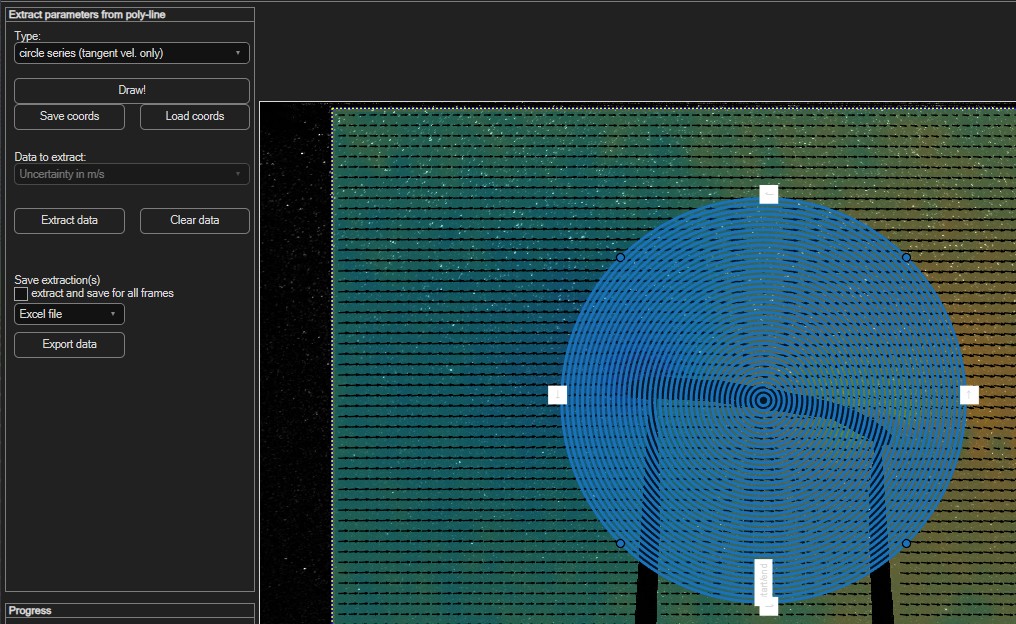
Extracting data
- Choose what to extract from Data to extract — the same derived-parameter list as Deriving spatial parameters, plus Tangent velocity and Normal velocity, which project the velocity onto the direction along or across your line or circle.
- Click Extract data to plot the profile along your line or circle.
- Click Clear data to remove it and start over.
Tangent vs. normal velocity.
Tangent velocity is the velocity component parallel to the line
(or circle) — useful for the swirling velocity around a vortex core, for example.
Normal velocity is the component perpendicular to the line —
handy for the flow rate crossing a line, such as flux through a control surface. A positive
normal velocity points in the positive y-direction as set in the
spatial calibration (downwards by default). Both work on a polyline
or a single circle; a circle series supports tangent velocity only.
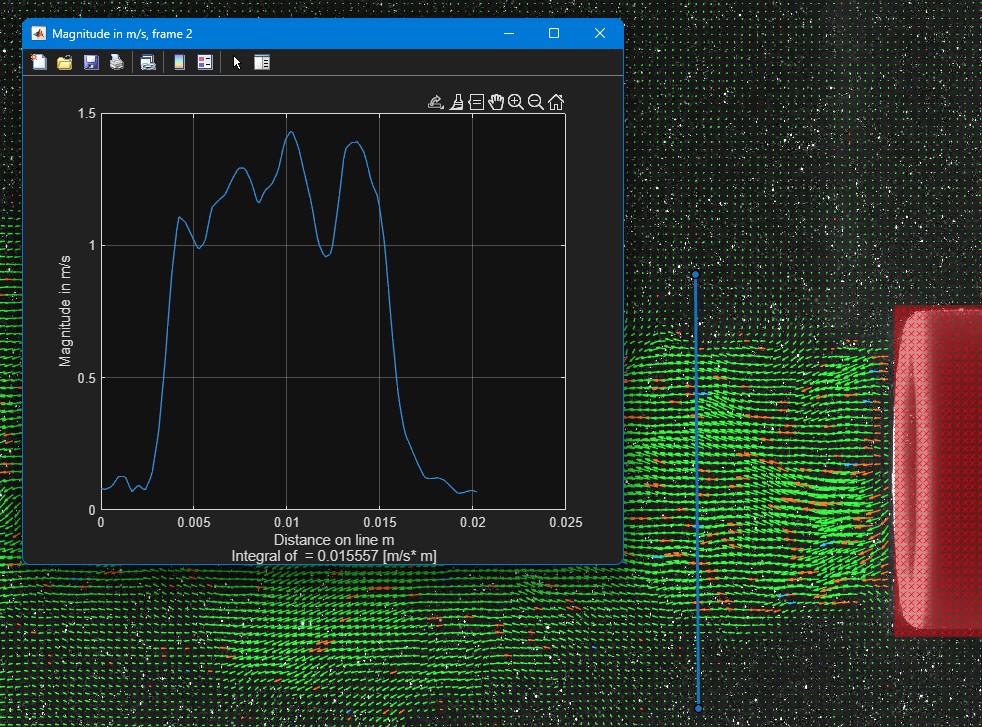
Saving the extraction
Tick extract and save for all frames to extract across the whole session rather than just the current frame, choose a file format (Excel file or Text file), then click Export data.
Want an average over a region instead?
See Parameters from area — same idea, but for a whole
enclosed area rather than a line or circle.